XKCDIFY is tool for converting most matlab plot to XKCD style plots!
XKCDIFY was designed to work in conjunction with the standard Matlab plotting utilities, making it compatible
with most matlab code. Simply create plot as you would with any of the standard 2D plotting tools and when you
satisfied you can then XKCDIFY them.
XKCDIFY works by iterating over the children of an axes and distorts the individual children based upon their TYPE.
Currently only children of type LINE or PATCH get distorted. Additionally if the child type is HGGROUP then XKCDIFY
iterates on the sub-children of the hggroup.
Usage Examples Code
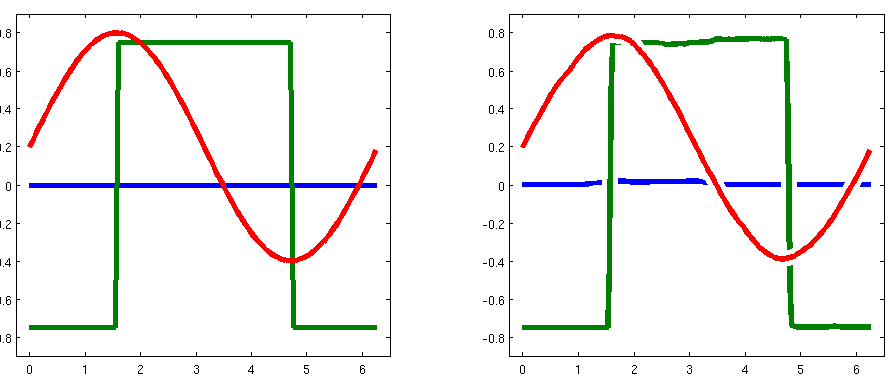
Here are a few examples of the types of plots that XKCDIFY can operate on. Each plot is drawn twice with the original
on the left and the XKCD style plot on the right.
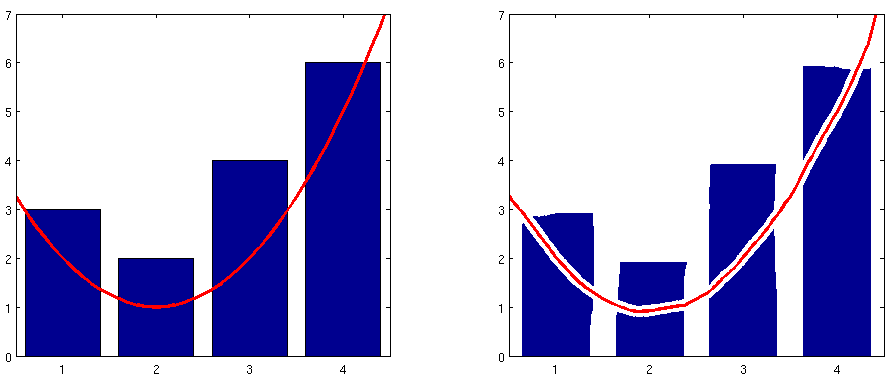
%%- Example 2, XKCDify a bar plot with a line plot on topclear; closeall; clc;
figure('Position', [1004601120420]);
a(1) =subplot(121); a(2) =subplot(122);
x = [0:.1:5];
y =1+ (x-2).^2;
bar([ 3246], 'Parent', a(1));
line(x,y,'Color', 'r', 'lineWidth', 3, 'Parent', a(1));
bar([ 3246], 'Parent', a(2));
line(x,y,'Color', 'r', 'lineWidth', 3, 'Parent', a(2));
set(a, 'XLim', [.54.5], 'YLim', [07]);
xkcdify(a(2));
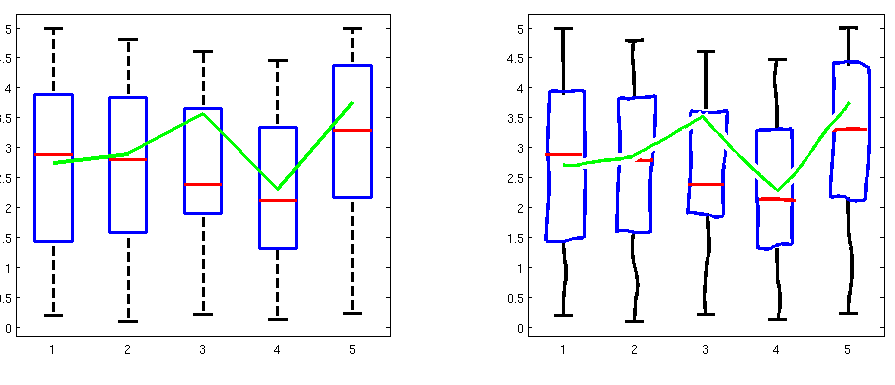
Box and Line Plots
clear; closeall; clc;
n =5; data =rand(20,n) *5;
x =1:n; y =mean(data) +rand(1,n);
figure('Position', [1004601120420]);
a(1) =subplot(121); a(2) =subplot(122);
boxplot( data, 'Parent', a(1));
set( get(get(a(1), 'Children'),'Children'), 'LineWidth', 3); % Hack to grow the line width of the boxplotline(x, y, 'color', 'g', 'linewidth', 3, 'Parent', a(1));
boxplot( data, 'Parent', a(2));
set( get(get(a(2), 'Children'),'Children'), 'LineWidth', 3); % Hack to grow the line width of the boxplotline(x, y, 'color', 'g', 'linewidth', 3, 'Parent', a(2));
xkcdify(gca)

 客服电话
客服电话
 APP下载
APP下载

 官方微信
官方微信


请发表评论