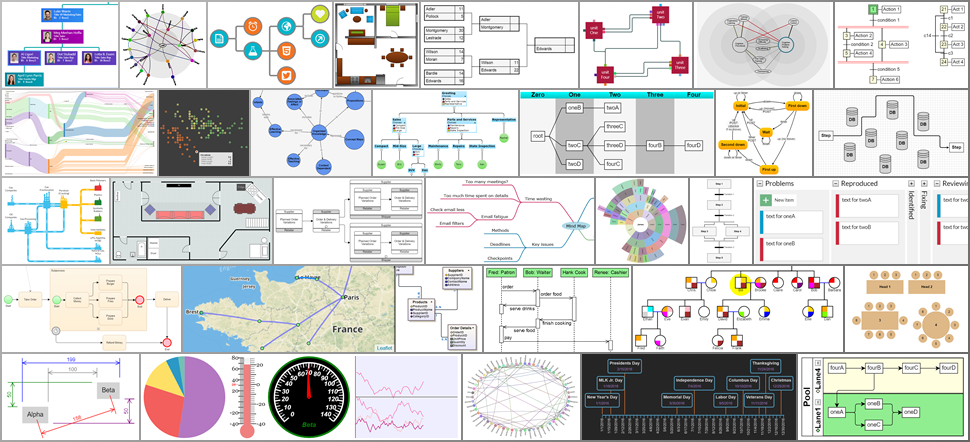
GoJS is rendered with an HTML Canvas element (with export to SVG or image formats). GoJS can run in a web browser, or server side in Node or Puppeteer. GoJS Diagrams are backed by Models, with saving and loading typically via JSON.
This repository contains both the library and the sources for all samples, extensions, and documentation.
You can use the GitHub repository to quickly search through all of the sources.
Minimal Sample
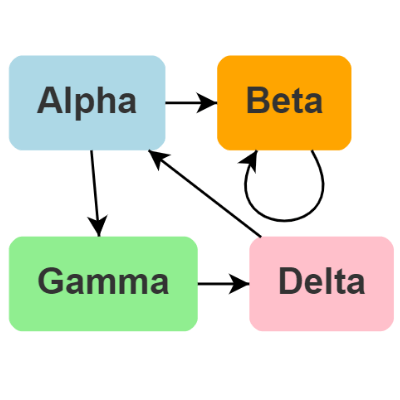
Graphs are constructed by creating one or more templates, with desired properties data-bound, and adding model data.
<divid="myDiagramDiv"></div><scriptsrc="https://unpkg.com/gojs"></script><script>constmyDiagram=newgo.Diagram("myDiagramDiv",// create a Diagram for the HTML Div element{"undoManager.isEnabled": true});// enable undo & redo// define a simple Node templatemyDiagram.nodeTemplate=newgo.Node("Auto")// the Shape will automatically surround the TextBlock// add a Shape and a TextBlock to this "Auto" Panel.add(newgo.Shape("RoundedRectangle",{strokeWidth: 0,fill: "white"})// no border; default fill is white.bind("fill","color"))// Shape.fill is bound to Node.data.color.add(newgo.TextBlock({margin: 8,stroke: "#333"})// some room around the text.bind("text","key"));// TextBlock.text is bound to Node.data.key// but use the default Link template, by not setting Diagram.linkTemplate// create the model data that will be represented by Nodes and LinksmyDiagram.model=newgo.GraphLinksModel([{key: "Alpha",color: "lightblue"},{key: "Beta",color: "orange"},{key: "Gamma",color: "lightgreen"},{key: "Delta",color: "pink"}],[{from: "Alpha",to: "Beta"},{from: "Alpha",to: "Gamma"},{from: "Beta",to: "Beta"},{from: "Gamma",to: "Delta"},{from: "Delta",to: "Alpha"}]);</script>
The above diagram and model code creates the following graph.
The user can now click on nodes or links to select them, copy-and-paste them, drag them, delete them, scroll, pan, and zoom, with a mouse or with fingers.
Click the image to see the interactive GoJS Diagram
Support
Northwoods Software offers a month of free developer-to-developer support for GoJS to help you get started on your project.
Read and search the official GoJS forum for any topics related to your questions.
Posting in the forum is the fastest and most effective way of obtaining support for any GoJS related inquiries.
Please register for support at Northwoods Software's registration form before posting in the forum.
For any nontechnical questions about GoJS, such as about sales or licensing,
please visit Northwoods Software's contact form.

 客服电话
客服电话
 APP下载
APP下载

 官方微信
官方微信


请发表评论