Package chart is a very simple golang native charting library that supports timeseries and continuous line charts.
Master should now be on the v3.x codebase, which overhauls the api significantly. Per usual, see examples for more information.
Installation
To install chart run the following:
> go get -u github.com/wcharczuk/go-chart
Most of the components are interchangeable so feel free to crib whatever you want.
Output Examples
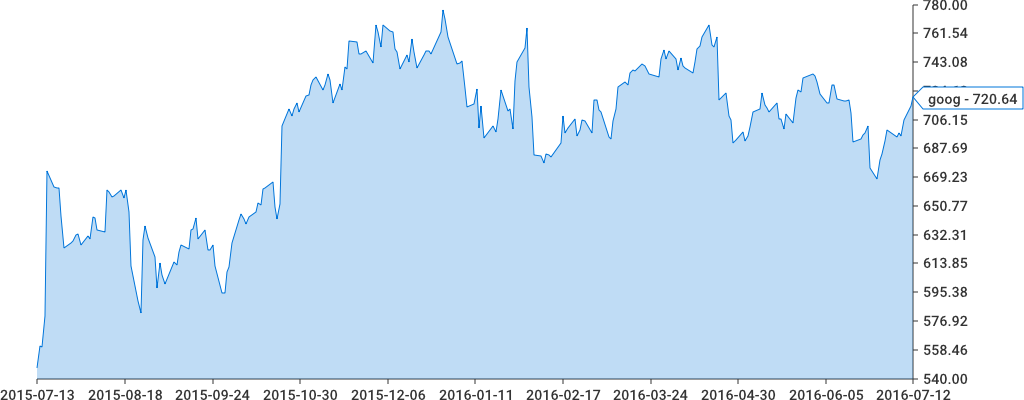
Spark Lines:
Single axis:
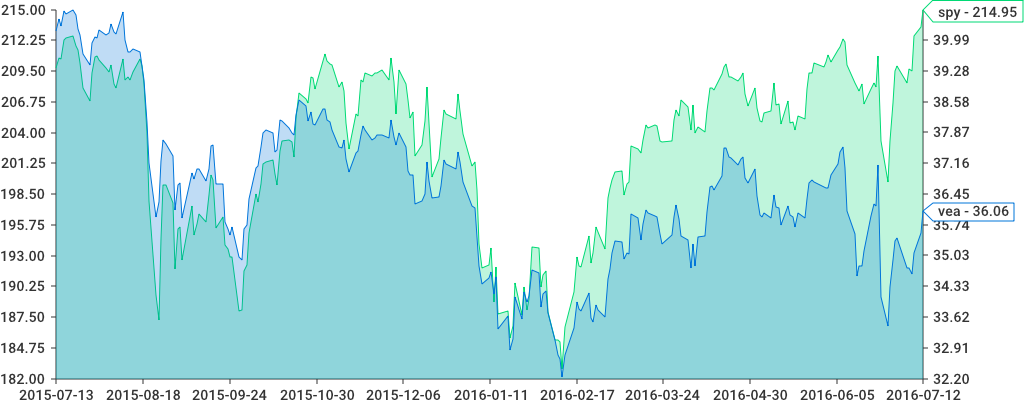
Two axis:
Other Chart Types
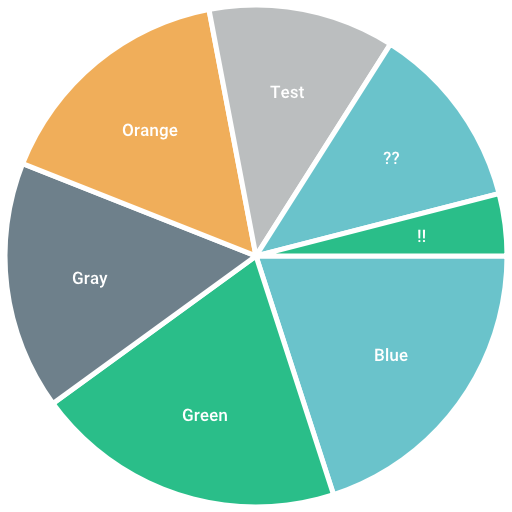
Pie Chart:
The code for this chart can be found in examples/pie_chart/main.go.
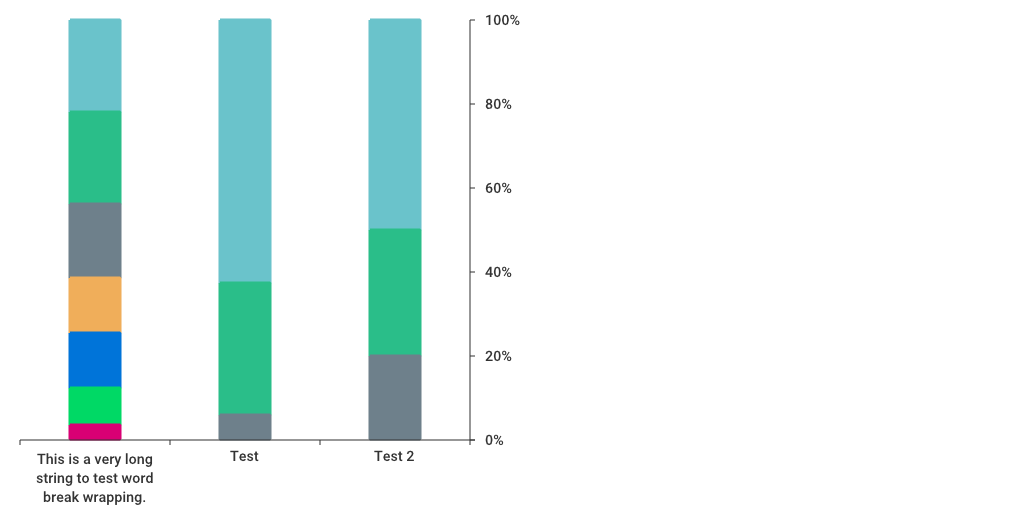
Stacked Bar:
The code for this chart can be found in examples/stacked_bar/main.go.
Code Examples
Actual chart configurations and examples can be found in the ./examples/ directory. They are simple CLI programs that write to output.png (they are also updated with go generate.
Usage
Everything starts with the chart.Chart object. The bare minimum to draw a chart would be the following:
Explanation of the above: A chart can have many Series, a Series is a collection of things that need to be drawn according to the X range and the Y range(s).
Here, we have a single series with x range values as float64s, rendered to a PNG. Note; we can pass any type of io.Writer into Render(...), meaning that we can render the chart to a file or a resonse or anything else that implements io.Writer.
API Overview
Everything on the chart.Chart object has defaults that can be overriden. Whenever a developer sets a property on the chart object, it is to be assumed that value will be used instead of the default.
The best way to see the api in action is to look at the examples in the ./_examples/ directory.
Design Philosophy
I wanted to make a charting library that used only native golang, that could be stood up on a server (i.e. it had built in fonts).
The goal with the API itself is to have the "zero value be useful", and to require the user to not code more than they absolutely needed.
Contributions
Contributions are welcome though this library is in a holding pattern for the forseable future.

 客服电话
客服电话
 APP下载
APP下载

 官方微信
官方微信


请发表评论