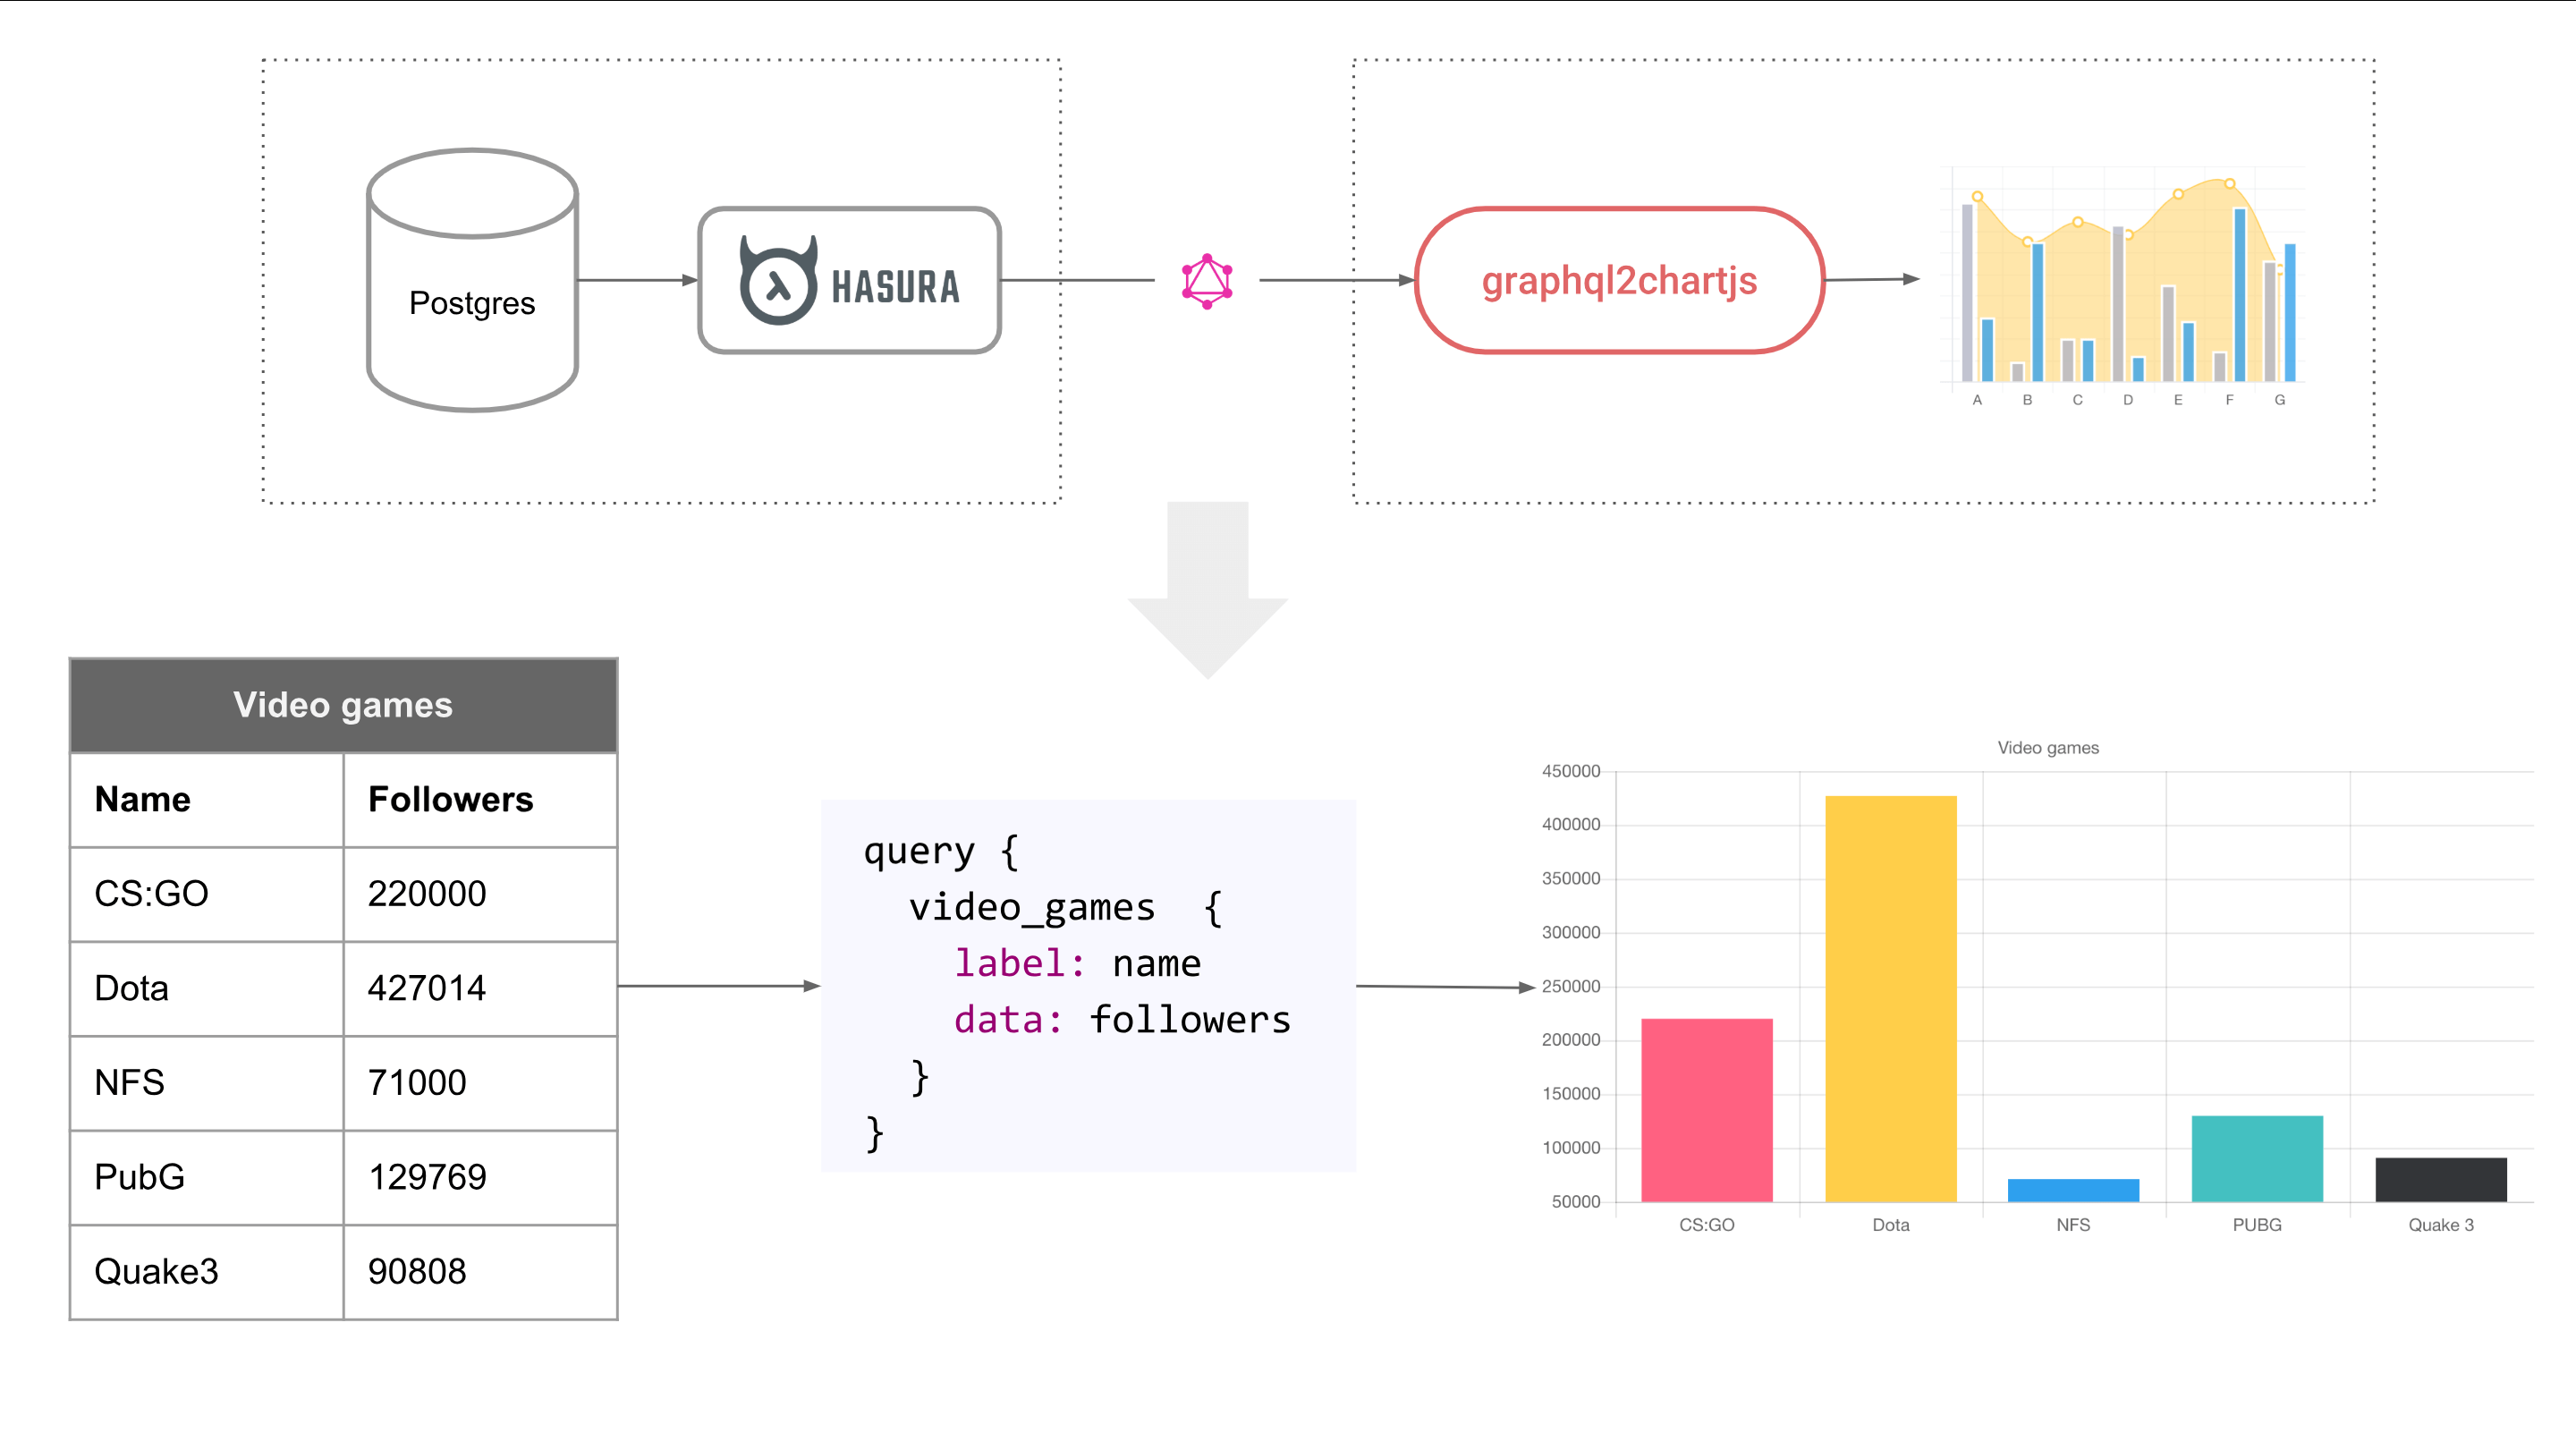
Hasura gives you an instant realtime GraphQL API on an existing Postgres database. You can create views to capture analytics and aggregations on your database and instantly turn them into charts.
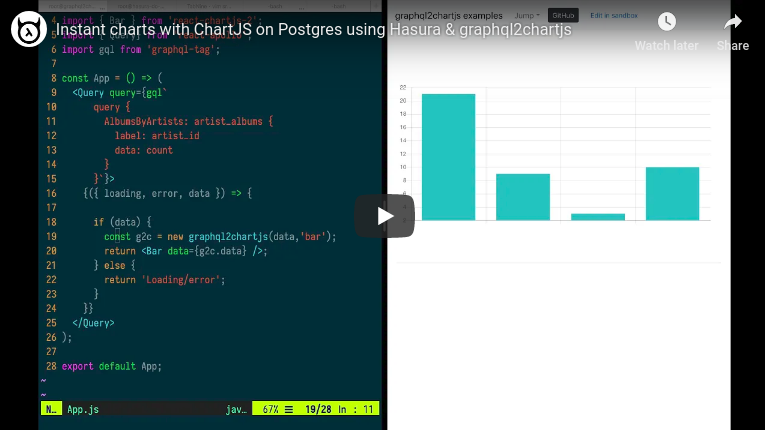
Watch this video below to see a demo/tutorial of using Hasura with an existing Postgres database, creating views and building charts.
Example usage with react, apollo and react-chartjs-2
Different types of charts need different structures in their datasets.
For example a bar chart dataset needs labels and data associated for each label; the ChartJS API refers to this as label and data. Once you alias fields in your graphql query to label and data, and pass the response through graphql2chartjs, your dataset is ready to be used by bar chart in chartjs.
Bar / Line / Doughnut / Pie / Radar / Polar Area / Area
Charts of this type need 2 data inputs, label and data.
Initialise graphql2chartjs: const g2c = new graphql2chartjs()
Add data from your graphql response: g2c.add(graphqlResponse.data, 'line')
Set your chart data to the data properly of the graphql2chartjs instance: g2c.data
Step 1: Initialiase with data: new graphql2chartjs()
Option 1: Initialise with data and chart type
graphql2chartjs(data, chartType)
constg2c=newgraphql2chartjs(data,'bar');
data: This is your GraphQL response. This data should have fields label, data etc. as per the GraphQL querying described above.
chartType: This is a string that represents valid values of what your chart type is. Valid values include 'line', 'bar', 'radar', 'doughnut', 'pie', 'polarArea', 'bubble', 'scatter'.
Notes:
This is the simplest way of using graphql2chartjs
If you have multiple datasets, all of the datasets will be rendered automatically as the same type of chart
To customise the UI options of the rendered chart like colors or to create a mixed type chart (one dataset is rendered as a line chart, another as a bar chart) use the next initialisation method instead of this one.
Option 2: Initialise with data and a transform function
graphql2chartjs(data, transform)
The transformation function can add chartjs dataset props or even modify the record data:
transform(datasetName, dataPoint): This function defined by you can take the name of the dataset and the data record that comes from the GraphQL response and returns an object that can should have the chartType key and optionally other keys that specify other dataset properties.
The object returned by this function should look like the following:
Step 2: Now create your chart with data - g2c.data
g2c.data gives you access to the latest ChartJS data that can be passed to your chart.
Javascript
varmyChart=newChart(ctx,{data: g2c.data});
react-chartjs-2
<Bardata={g2c.data}/>
Step 3: (optional) Incrementally add data for your chart
g2c.add()
Once you've initialised a graphql2chartjs object, you can use the add function to add data for the first time or incrementally:
awaitdata=runQuery(..);// Add for a chart typeg2c.add(data,'line');// Add with a transformation function to change UI props for the new data added or udpatedg2c.add(data,(datasetName,dataPoint)=>{chartType: 'line',pointBackgroundColor: 'yellow'});
You can reform the existing data in your graphql2chartjs instance using the reform function that takes a reformer function as an argument. This reformer function is run over every datapoint in every dataset. For instance, to scale the x and y coordinates, you would do something like:
g2c.reform((datasetName, dataPoint) => {
  // scale the x, y coordinates
  return {
    data_x: scalingFactor(dataPoint.data_x),
    data_y: scalingFactor(dataPoint.data_y)
  }
})

 客服电话
客服电话
 APP下载
APP下载

 官方微信
官方微信


请发表评论