开源软件名称:geemap
开源软件地址:https://gitee.com/domic/geemap
开源软件介绍:
geemap            Lead authors: Dr. Qiusheng Wu (https://wetlands.io) A Python package for interactive mapping with Google Earth Engine, ipyleaflet, and ipywidgets. Contents Introductiongeemap is a Python package for interactive mapping with Google Earth Engine (GEE), which is a cloud computing platform with a multi-petabyte catalog of satellite imagery and geospatial datasets. During the past few years,GEE has become very popular in the geospatial community and it has empowered numerous environmental applications at local, regional, and global scales. GEE provides both JavaScript and Python APIs formaking computational requests to the Earth Engine servers. Compared with the comprehensive documentation and interactive IDE (i.e., GEE JavaScript Code Editor) of the GEE JavaScript API,the GEE Python API has relatively little documentation and limited functionality for visualizing results interactively. The geemap Python package was created to fill this gap. It is built upon ipyleaflet and ipywidgets, and enables users toanalyze and visualize Earth Engine datasets interactively within a Jupyter-based environment. geemap is intended for students and researchers, who would like to utilize the Python ecosystem of diverse libraries and tools to explore Google Earth Engine. It is also designed for existing GEE users who would like to transition from the GEE JavaScript API to Python API. The automated JavaScript-to-Python conversion module of the geemap packagecan greatly reduce the time needed to convert existing GEE JavaScripts to Python scripts and Jupyter notebooks. For video tutorials and notebook examples, please visit https://github.com/giswqs/geemap/tree/master/examples. For complete documentation on geemap modules and methods, please visit https://geemap.readthedocs.io/en/latest/source/geemap.html. If you find geemap useful in your research, please consider citing the following papers to support my work. Thank you for your support. - Wu, Q., (2020). geemap: A Python package for interactive mapping with Google Earth Engine. The Journal of Open Source Software, 5(51), 2305. https://doi.org/10.21105/joss.02305
- Wu, Q., Lane, C. R., Li, X., Zhao, K., Zhou, Y., Clinton, N., DeVries, B., Golden, H. E., & Lang, M. W. (2019). Integrating LiDAR data and multi-temporal aerial imagery to map wetland inundation dynamics using Google Earth Engine. Remote Sensing of Environment, 228, 1-13. https://doi.org/10.1016/j.rse.2019.04.015 (pdf | source code)
FeaturesBelow is a partial list of features available for the geemap package. Please check the examples page for notebook examples, GIF animations, and video tutorials. - Automated conversion from Earth Engine JavaScripts to Python scripts and Jupyter notebooks.
- Displaying Earth Engine data layers for interactive mapping.
- Supporting Earth Engine JavaScript API-styled functions in Python, such as
Map.addLayer(), Map.setCenter(), Map.centerObject(), Map.setOptions(). - Creating split-panel maps with Earth Engine data.
- Retrieving Earth Engine data interactively using the Inspector Tool.
- Interactive plotting of Earth Engine data by simply clicking on the map.
- Converting data format between GeoJSON and Earth Engine.
- Using drawing tools to interact with Earth Engine data.
- Using shapefiles with Earth Engine without having to upload data to one's GEE account.
- Exporting Earth Engine FeatureCollection to other formats (i.e., shp, csv, json, kml, kmz) using only one line of code.
- Exporting Earth Engine Image and ImageCollection as GeoTIFF.
- Extracting pixels from an Earth Engine Image into a 3D numpy array.
- Calculating zonal statistics by group (e.g., calculating land over composition of each state/country).
- Adding a customized legend for Earth Engine data.
- Converting Earth Engine JavaScripts to Python code directly within Jupyter notebook.
- Adding animated text to GIF images generated from Earth Engine data.
- Adding colorbar and images to GIF animations generated from Earth Engine data.
- Creating Landsat timelapse animations with animated text using Earth Engine.
- Searching places and datasets from Earth Engine Data Catalog.
- Using timeseries inspector to visualize landscape changes over time.
- Exporting Earth Engine maps as HTML files and PNG images.
- Searching Earth Engine API documentation within Jupyter notebooks.
- Importing Earth Engine assets from personal account.
- Publishing interactive GEE maps directly within Jupyter notebook.
- Adding local raster datasets (e.g., GeoTIFF) to the map.
- Performing image classification and accuracy assessment.
- Extracting pixel values interactively.
InstallationTo use geemap, you must first sign up for a Google Earth Engine account.  geemap is available on PyPI. To install geemap, run this command in your terminal: pip install geemap geemap is also available on conda-forge. If you have Anaconda or Miniconda installed on your computer, you can create a conda Python environment to install geemap: conda create -n gee python=3.7conda activate geeconda install mamba -c conda-forgemamba install geemap -c conda-forge Optionally, you can install Jupyter notebook extensions, which can improve your productivity in the notebook environment. Some useful extensions include Table of Contents, Gist-it, Autopep8, Variable Inspector, etc. See this post for more information. mamba install jupyter_contrib_nbextensions -c conda-forge If you have installed geemap before and want to upgrade to the latest version, you can run the following command in your terminal: pip install -U geemap If you use conda, you can update geemap to the latest version by running the following command in your terminal: mamba update -c conda-forge geemap To install the development version from GitHub using Git, run the following command in your terminal: pip install git+https://github.com/giswqs/geemap To install the development version from GitHub directly within Jupyter notebook without using Git, run the following code: import geemapgeemap.update_package() To use geemap in a Docker container, check out this page. UsageImportant note: A key difference between ipyleaflet and folium is that ipyleaflet is built upon ipywidgets and allows bidirectionalcommunication between the front-end and the backend enabling the use of the map to capture user input, while folium is meant for displayingstatic data only (source).Note that Google Colab currently does not support ipyleaflet(source). Therefore, if you are using geemap with Google Colab, you should useimport geemap.eefolium. If you are using geemap with binder or a local Jupyter notebook server,you can use import geemap, which provides more functionalities for capturing user input (e.g.,mouse-clicking and moving). More GEE Tutorials are available on my YouTube channel. 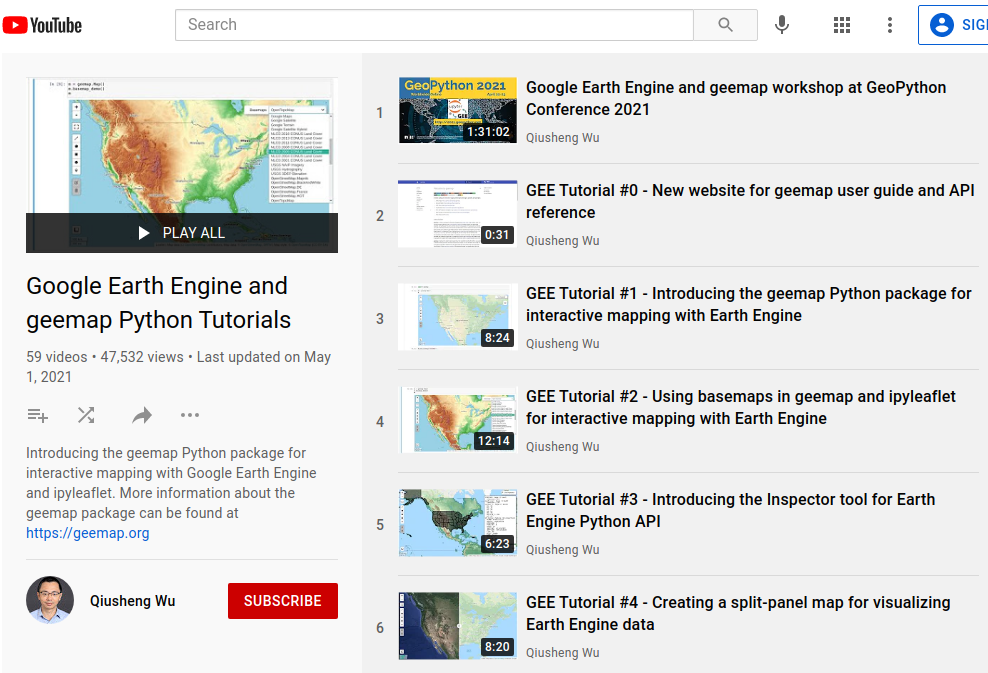
To create an ipyleaflet-based interactive map: import geemapMap = geemap.Map(center=[40,-100], zoom=4)Map To create a folium-based interactive map: import geemap.eefolium as emapMap = emap.Map(center=[40,-100], zoom=4)Map To add an Earth Engine data layer to the Map: Map.addLayer(ee_object, vis_params, name, shown, opacity) To center the map view at a given coordinates with the given zoom level: Map.setCenter(lon, lat, zoom) To center the map view around an Earth Engine object: Map.centerObject(ee_object, zoom) To add LayerControl to a folium-based Map: Map.addLayerControl() To add a minimap (overview) to an ipyleaflet-based Map: Map.add_minimap() To add additional basemaps to the Map: Map.add_basemap('Esri Ocean')Map.add_basemap('Esri National Geographic')To add an XYZ tile layer to the Map: url = 'https://mt1.google.com/vt/lyrs=m&x={x}&y={y}&z={z}'Map.add_tile_layer(url, name='Google Map', attribution='Google')To add a WMS layer to the Map: naip_url = 'https://services.nationalmap.gov/arcgis/services/USGSNAIPImagery/ImageServer/WMSServer?'Map.add_wms_layer(url=naip_url, layers='0', name='NAIP Imagery', format='image/png', shown=True) To convert a shapefile to Earth Engine object and add it to the Map: ee_object = geemap.shp_to_ee(shp_file_path)Map.addLayer(ee_object, {}, 'Layer name')To convert a GeoJSON file to Earth Engine object and add it to the Map: ee_object = geemap.geojson_to_ee(geojson_file_path)Map.addLayer(ee_object, {}, 'Layer name')To download an ee.FeatureCollection as a shapefile: geemap.ee_to_csv(ee_object, filename, selectors) To export an ee.FeatureCollection to other formats, including shp, csv, json, kml, and kmz: geemap.ee_export_vector(ee_object, filename, selectors) To export an ee.Image as a GeoTIFF file: geemap.ee_export_image(ee_object, filename, scale, crs, region, file_per_band) To export an ee.ImageCollection as GeoTIFF files: geemap.ee_export_image_collection(ee_object, output, scale, crs, region, file_per_band) To extract pixels from an ee.Image into a 3D numpy array: geemap.ee_to_numpy(ee_object, bands, region, properties, default_value) To calculate zonal statistics: geemap.zonal_statistics(in_value_raster, in_zone_vector, out_file_path, statistics_type='MEAN') To calculate zonal statistics by group: geemap.zonal_statistics_by_group(in_value_raster, in_zone_vector, out_file_path, statistics_type='SUM') To create a split-panel Map: Map.split_map(left_layer='HYBRID', right_layer='ESRI') To add a marker cluster to the Map: Map.marker_cluster()feature_collection = ee.FeatureCollection(Map.ee_markers) To add a customized legend to the Map: legend_dict = { 'one': (0, 0, 0), 'two': (255,255,0), 'three': (127, 0, 127)}Map.add_legend(legend_title='Legend', legend_dict=legend_dict, position='bottomright')Map.add_legend(builtin_legend='NLCD')To download a GIF from an Earth Engine ImageCollection: geemap.download_ee_video(tempCol, videoArgs, saved_gif) To add animated text to an existing GIF image: geemap.add_text_to_gif(in_gif, out_gif, xy=('5%', '5%'), text_sequence=1984, font_size=30, font_color='#0000ff', duration=100)To create a colorbar for an Earth Engine image: palette = ['blue', 'purple', 'cyan', 'green', 'yellow', 'red']create_colorbar(width=250, height=30, palette=palette, vertical=False,add_labels=True, font_size=20, labels=[-40, 35]) To create a Landsat timelapse animation and add it to the Map: Map.add_landsat_ts_gif(label='Place name', start_year=1985, bands=['NIR', 'Red', 'Green'], frames_per_second=5) To convert all GEE JavaScripts in a folder recursively to Python scripts: from geemap.conversion import *js_to_python_dir(in_dir, out_dir) To convert all GEE Python scripts in a folder recursively to Jupyter notebooks: from geemap.conversion import *template_file = get_nb_template()py_to_ipynb_dir(in_dir, template_file, out_dir) To execute all Jupyter notebooks in a folder recursively and save output cells: from geemap.conversion import *execute_notebook_dir(in_dir) To search Earth Engine API documentation with Jupyter notebooks: import geemapgeemap.ee_search() To publish an interactive GEE map with Jupyter notebooks: Map.publish(name, headline, visibility) To add a local raster dataset to the map: Map.add_raster(image, bands, colormap, layer_name) To get image basic properties: geemap.image_props(image).getInfo() To get image descriptive statistics: geemap.image_stats(image, region, scale) To remove all user-drawn geometries: geemap.remove_drawn_features() To extract pixel values based on user-drawn geometries: geemap.extract_values_to_points(out_shp) ExamplesThe following examples require the geemap package, which can be installed using pip install geemap. Check the Installation section for more information. More examples can be found atanother repo: A collection of 300+ Jupyter Python notebook examples for using Google Earth Engine with interactive mapping. Converting GEE JavaScripts to Python scripts and Jupyter notebooksLaunch an interactive notebook with Google Colab. Keep in mind that the conversion might not always work perfectly. Additional manual changes might still be needed. ui and chart are not supported.The source code for this automated conversion module can be found at conversion.py. import osfrom geemap.conversion import *# Create a temporary working directorywork_dir = os.path.join(os.path.expanduser('~'), 'geemap')# Get Earth Engine JavaScript examples. There are five examples in the geemap package folder.# Change js_dir to your own folder containing your Earth Engine JavaScripts, such as js_dir = '/path/to/your/js/folder'js_dir = get_js_examples(out_dir=work_dir)# Convert all Earth Engine JavaScripts in a folder recursively to Python scripts.js_to_python_dir(in_dir=js_dir, out_dir=js_dir, use_qgis=True)print("Python scripts saved at: {}".format(js_dir))# Convert all Earth Engine Python scripts in a folder recursively to Jupyter notebooks.nb_template = get_nb_template() # Get the notebook template from the package folder.py_to_ipynb_dir(js_dir, nb_template)# Execute all Jupyter notebooks in a folder recursively and save the output cells.execute_notebook_dir(in_dir=js_dir) Interactive mapping using GEE Python API and geemapLaunch an interactive notebook with Google Colab. Note that Google Colab currently does not support ipyleaflet. Therefore, you should use import geemap.eefolium instead of import geemap. # Installs geemap packageimport subprocesstry: import geemapexcept ImportError: print('geemap package not installed. Installing ...') subprocess.check_call(["python", '-m', 'pip', 'install', 'geemap'])# Checks whether this notebook is running on Google Colabtry: import google.colab import geemap.eefolium as emapexcept: import geemap as emap# Authenticates and initializes Earth Engineimport eetry: ee.Initialize()except Exception as e: ee.Authenticate() ee.Initialize()# Creates an interactive mapMap = emap.Map(center=[40,-100], zoom=4)# Adds Earth Engine datasetimage = ee.Image('USGS/SRTMGL1_003')# Sets visualization parameters.vis_params = { 'min': 0, 'max': 4000, 'palette': ['006633', 'E5FFCC', '662A00', 'D8D8D8', 'F5F5F5']}# Prints the elevation of Mount Everest.xy = ee.Geometry.Point([86.9250, 27.9881])elev = image.sample(xy, 30).first().get('elevation').getInfo()print('Mount Everest elevation (m):', elev)# Adds Earth Engine layers to MapMap.addLayer(image, vis_params, 'SRTM DEM', True, 0.5)Map.addLayer(xy, {'color': 'red'}, 'Mount Everest')Map.setCenter(100, 40, 4)# Map.centerObject(xy, 13)# Display the MapMap.addLayerControl()Map DependenciesContributingContributions are welcome, and they are greatly appreciated! Every little bithelps, and credit will always be given. You can contribute in many ways: Report BugsReport bugs at https://github.com/giswqs/geemap/issues. If you are reporting a bug, please include: - Your operating system name and version.
- Any details about your local setup that might be helpful in troubleshooting.
- Detailed steps to reproduce the bug.
Fix BugsLook through the GitHub issues for bugs. Anything tagged with "bug" and "helpwanted" is open to whoever wants to implement it. Implement FeaturesLook through the GitHub issues for features. Anything tagged with "enhancement"and "help wanted" is open to whoever wants to implement it. Write Documentationgeemap could always use more documentation, whether as part of theofficial geemap docs, in docstrings, or even on the web in blog posts,articles, and such. Submit FeedbackThe best way to send feedback is to file an issue at https://github.com/giswqs/geemap/issues. If you are proposing a feature: - Explain in detail how it would work.
- Keep the scope as narrow as possible, to make it easier to implement.
- Remember that this is a volunteer-driven project, and that contributionsare welcome :)
Get Started!Ready to contribute? Here's how to set up geemap for local development. Fork the geemap repo on GitHub. Clone your fork locally: $ git clone [email protected]:your_name_here/geemap.git Install your local copy into a virtualenv. Assuming you have virtualenvwrapper installed, this is how you set up your fork for local development: $ mkvirtualenv geemap$ cd geemap/$ python setup.py develop Create a branch for local development: $ git checkout -b name-of-your-bugfix-or-feature Now you can make your changes locally. When you're done making changes, check that your changes pass flake8 and thetests, including testing other Python versions with tox: $ flake8 geemap tests$ python setup.py test or pytest$ tox To get flake8 and tox, just pip install them into your virtualenv. Commit your changes and push your branch to GitHub: $ git add .$ git commit -m "Your detailed description of your changes."$ git push origin name-of-your-bugfix-or-feature Submit a pull request through the GitHub website.
Pull Request GuidelinesBefore you submit a pull request, check that it meets these guidelines: - The pull request should include tests.
- If the pull request adds functionality, the docs should be updated. Putyour new functionality into a function with a docstring, and add thefeature to the list in README.rst.
- The pull request should work for Python 3.6, 3.7 and 3.8, and for PyPy. Checkhttps://travis-ci.com/giswqs/geemap/pull_requestsand make sure that the tests pass for all supported Python versions.
TipsTo run a subset of tests: $ python -m unittest tests.test_geemap DeployingA reminder for the maintainers on how to deploy.Make sure all your changes are committed (including an entry in HISTORY.rst).Then run: $ bump2version patch # possible: major / minor / patch$ git push$ git push --tags Travis will then deploy to PyPI if tests pass. ReferencesTo support my work, please consider citing the following articles: - Wu, Q., (2020). geemap: A Python package for interactive mapping with Google Earth Engine. The Journal of Open Source Software, 5(51), 2305. https://doi.org/10.21105/joss.02305
- Wu, Q., Lane, C. R., Li, X., Zhao, K., Zhou, Y., Clinton, N., DeVries, B., Golden, H. E., & Lang, M. W. (2019). Integrating LiDAR data and multi-temporal aerial imagery to map wetland inundation dynamics using Google Earth Engine. Remote Sensing of Environment, 228, 1-13. https://doi.org/10.1016/j.rse.2019.04.015 (pdf | source code)
CreditsThis package was created with Cookiecutter and the audreyr/cookiecutter-pypackage project template.  |

 客服电话
客服电话
 APP下载
APP下载

 官方微信
官方微信


请发表评论