See example_images for the outputs from these files (PNG). Note that publication-quality figures will usually require a vector graphics format (SVG/EPS/PDF) along with some manual editing to improve font clarity, etc. The examples shown here are in unedited raster format and are only meant to be illustrative.
Column data
From example_data/column_data.txt. Used with:
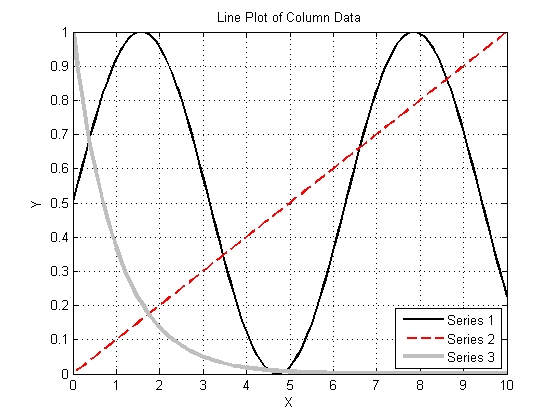
line_plot: Standard line plot with different formatting options
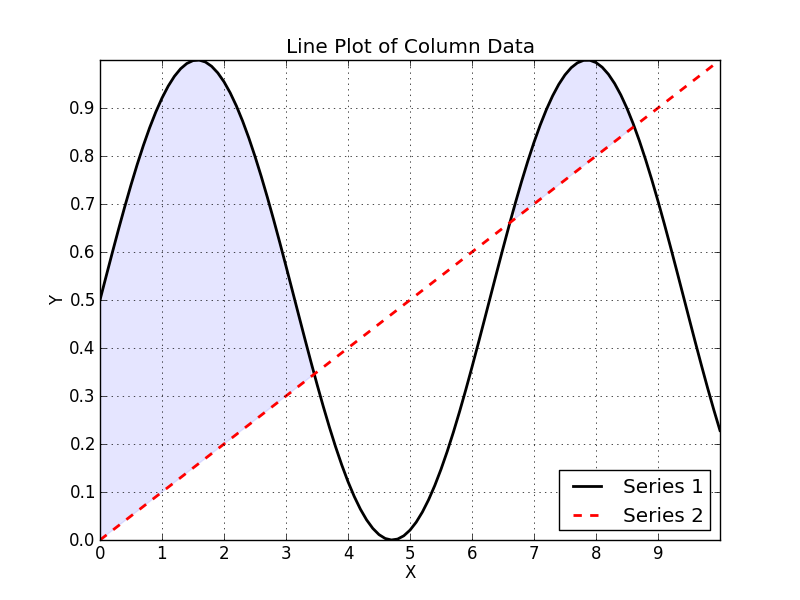
fill_between: Same data as line_plot, with shaded fill between Series 1 and Series 2
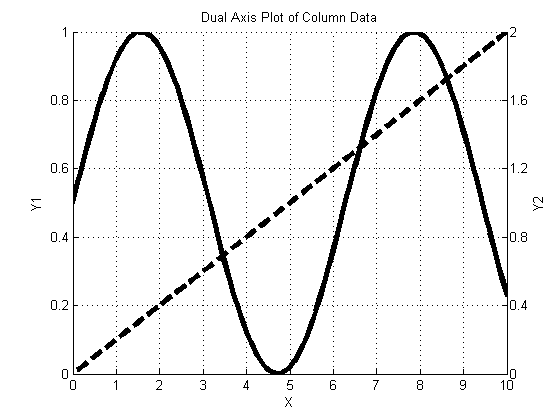
dual_axis: Plot column data using two different Y-axes
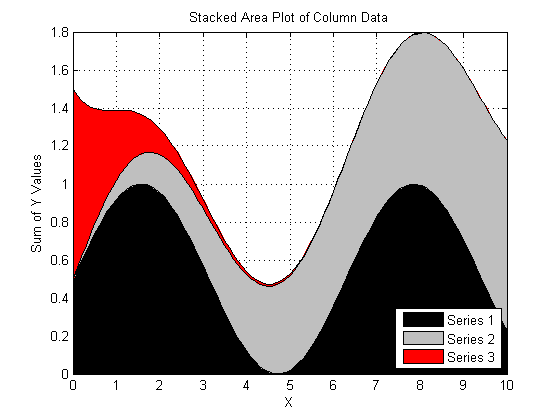
stacked_area: Stacked area plot with color options
animated_gif: Save loop of images as a .gif animation. The Python version requires you to use imagemagick after the fact to stick the frames together: convert -delay 15 -loop 0 frame*png animation.gif.
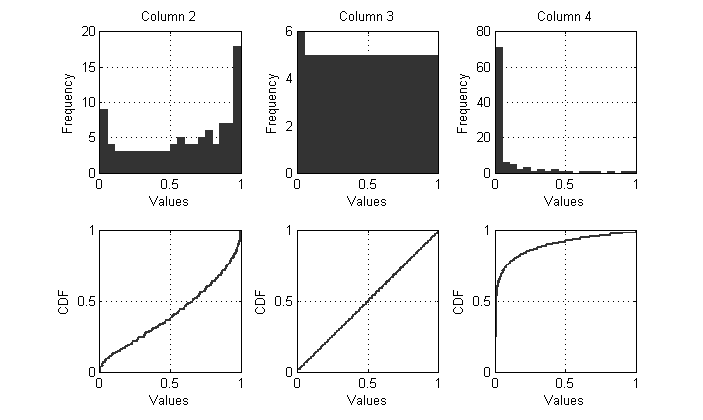
histogram_cdf: Standard plots of frequency distributions
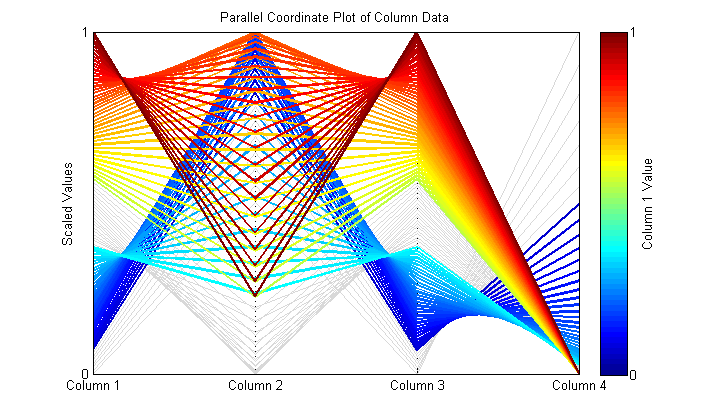
parallel_coordinate: Plots row entries as lines instead of columns. Options to scale all values between [0,1] and toggle solutions on/off above/below a certain threshold. (These functions are included in /util/).
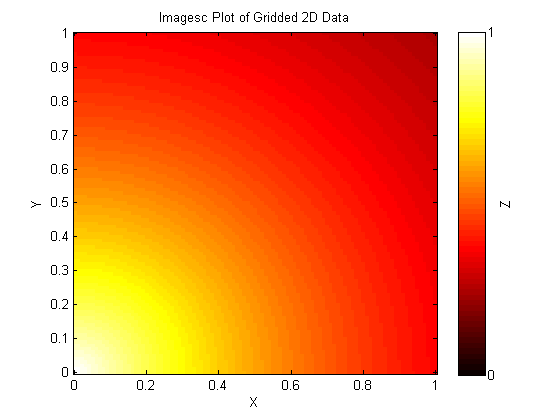
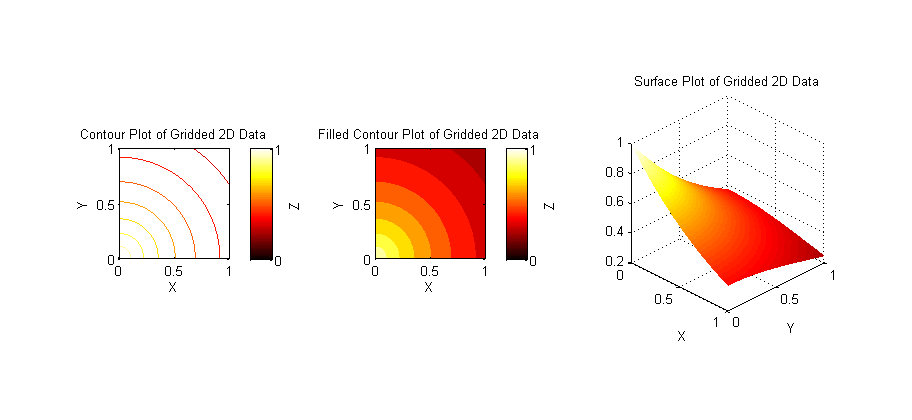
Gridded 2D data
From example_data/gridded_2D.txt. Used with:
imagesc_plot: Show matrix values directly as color blocks
contour_surf: Contour, filled contour, and surface plots of meshgrid data
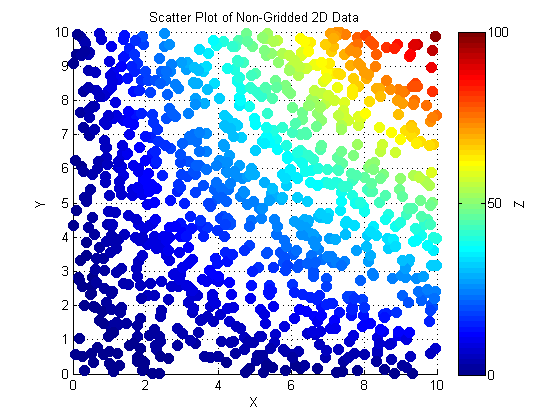
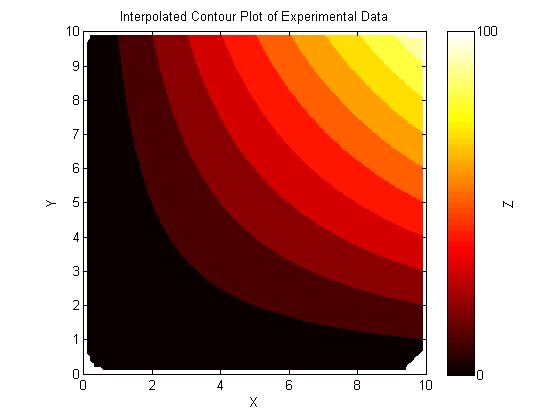
Non-Gridded 2D data (e.g. experimental data)
From example_data/non_gridded_2D.txt. The data file contains rows of (x,y,z) points that are not on a regular grid. Used with:
scatter_plot: Plot the irregularly spaced points as dots, with Z values as the color
contourf_non_gridded: Use Matlab's built-in griddata function to interpolate the data onto a standard meshgrid, which can then be used for standard contour/mesh/surf plots, etc.
3D Scatter Plot
From example_data/five_obj_data.txt. Used with:
3D-scatter: Plot data in 5 dimensions using R and Python.

 客服电话
客服电话
 APP下载
APP下载

 官方微信
官方微信


请发表评论